
Outbrain Click Prediction Eda
Summary
This post is an EDA workbook for Outbrain Click Prediction on Kaggle: https://www.kaggle.com/c/outbrain-click-prediction
Currently, Outbrain pairs relevant content with curious readers in about 250 billion personalized recommendations every month across many thousands of sites. In this competition, people are challenged to predict which pieces of content its global base of users are likely to click on. Improving Outbrain’s recommendation algorithm will mean more users uncover stories that satisfy their individual tastes.
Datasets: https://www.kaggle.com/c/outbrain-click-prediction/data This project has 10+ datasets. In this notebook, I am using pyspark SQL to examine relationships between different datasets, as well as create new variables
Below are some preliminary findings:
Page view sample table
- This sample contains 1-day (6/14) pageview data
- The average pageviews per document is 164 with the maximum of 429,551
- The average pageviews per user is 1.08 with the maximum of 14
- There won’t be a user viewing the same document more than once
Events table & Page view sample
- Timestamp:
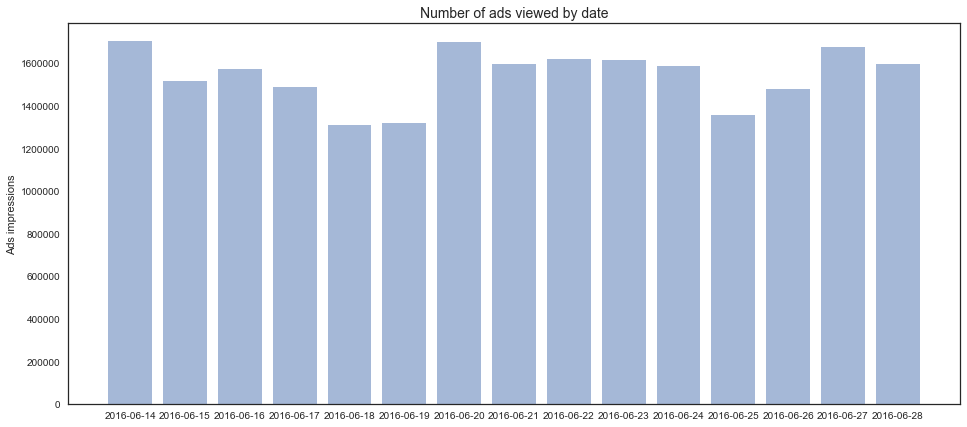
- Events table has data from 6/14 - 6/28
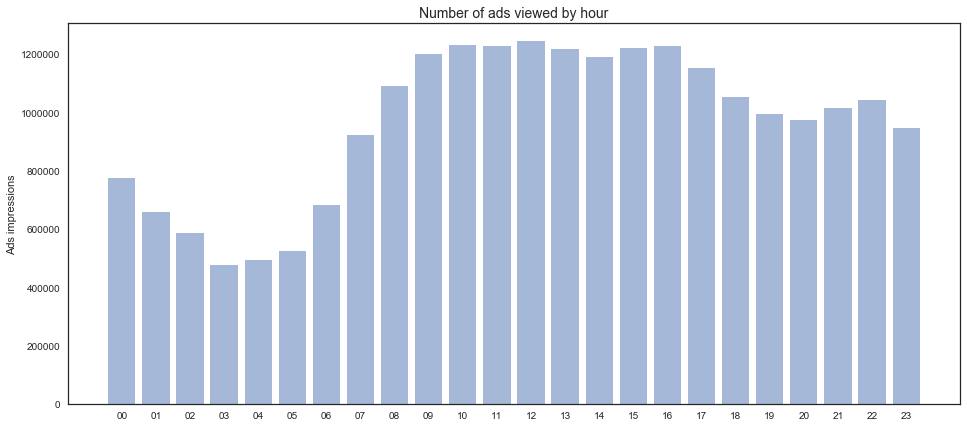
- Users viewed more ads during 9am - 5pm (12pm was the highest)
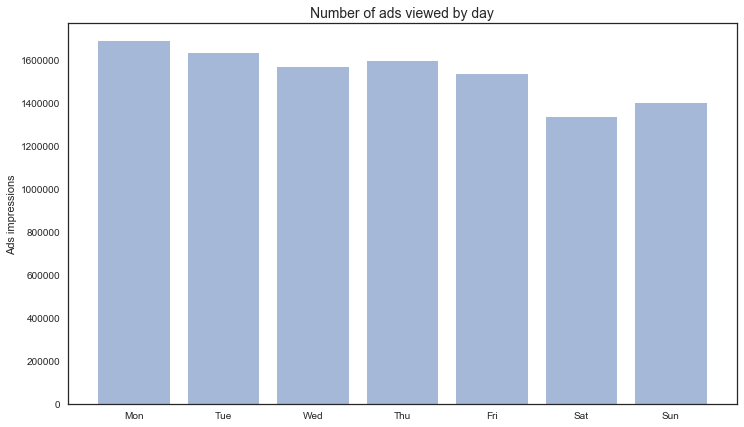
- Users viewed more ads during week days (Monday was the highest)
- Ad impressions by document:
- The average ad impressions per document is 25.8 with the maximum of 319,203
- 35.72% documents were viewed only once with ads
- 35.48% documents were viewed more than 5 times with ads
- 22.19% documents were viewed more than 10 times with ads
- 13.50% documents were viewed more than 20 times with ads
- Ad impressions by user:
- The average ad pageviews per user is 1.16 with the maximum of 49
- Users from desktop viewed more ads (avg 1.18) than tablet (avg 1.17) and mobile (avg 1.15)
- 88.42% users viewed ads only once
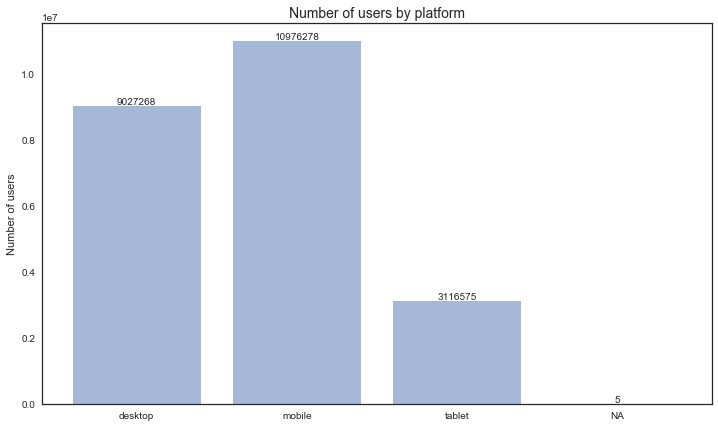
- User device
- 39.05% users came from desktop
- 47.47% users came from mobile
- 13.48% users came from tablet
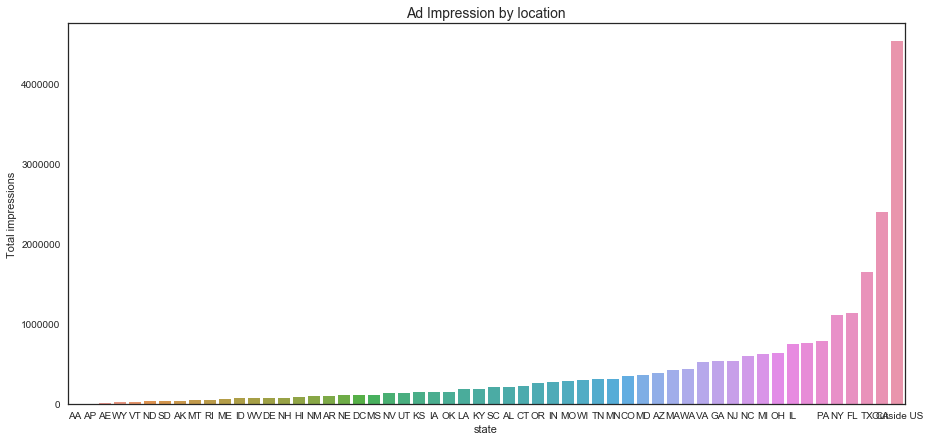
- Location
- 19% users were from outside US
- 10% users were from CA
- 7% users were from TX
- 4% users were from FL
- 4% users were from NY
- By joining the two tables, we’re able to calculate ad display rate on 6/14
- In general 1.29% of total impressions were associated with ads.
- Tablet had a higher ad display rate (1.75%) than desktop (1.39%) and mobile (1.11%)
Document tables
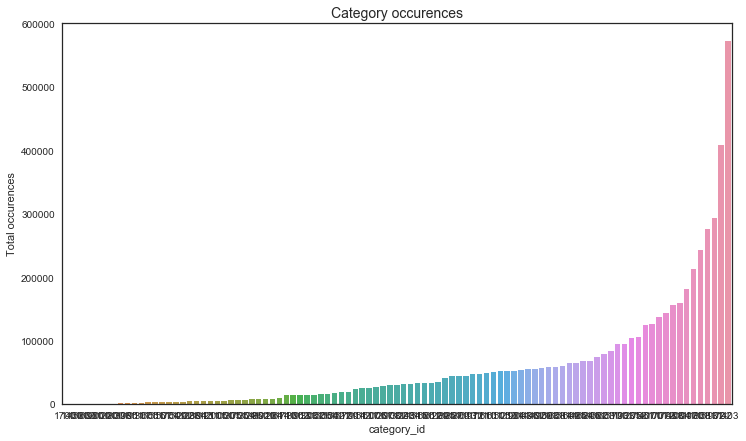
- Category
- 97 categories
- There were 8 categories that only appeared in less than 10 documents
- 90.722% of categories appeared in more than 1000 documents
- 67.010% of categories appeared in more than 10000 documents
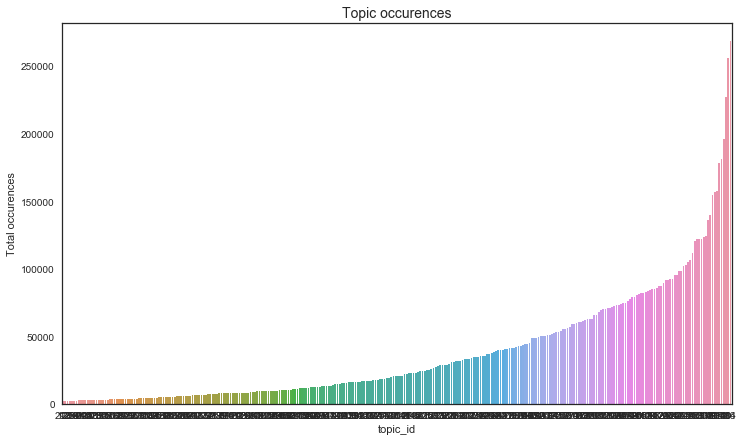
- Topic
- 300 topics
- 84.333% of topics appeared in more than 5000 documents
- 67.000% of topics appeared in more than 10000 documents
Train and test tables
- Train table
- 22.69% ads appeared once
- 49.32% ads appeared more than 5 times
- 36.24% ads appeared more than 10 times
- 82.87% ads in test dataset appeared in training dataset
import numpy as np
import pandas as pd
import matplotlib.pyplot as plt
import datetime

import seaborn as sns
plt.style.use('seaborn-white')
%matplotlib inline
pro=pd.read_csv("datasets/promoted_content.csv")
page_views (sample)
# read page_views in pyspark
df_page_views = spark.read.csv(
    path        =   "datasets/page_views_sample.csv",
    header      =   True,
    mode        =   "DROPMALFORMED",   # Poorly formed rows in CSV are dropped rather than erroring entire operation
    inferSchema =   True               # Not always perfect but works well in most cases as of 2.1+
)
df_page_views.printSchema()
root
 |-- uuid: string (nullable = true)
 |-- document_id: integer (nullable = true)
 |-- timestamp: integer (nullable = true)
 |-- platform: integer (nullable = true)
 |-- geo_location: string (nullable = true)
 |-- traffic_source: integer (nullable = true)
df_page_views.show(n=5)
+--------------+-----------+---------+--------+------------+--------------+
|          uuid|document_id|timestamp|platform|geo_location|traffic_source|
+--------------+-----------+---------+--------+------------+--------------+
|1fd5f051fba643|        120| 31905835|       1|          RS|             2|
|8557aa9004be3b|        120| 32053104|       1|       VN>44|             2|
|c351b277a358f0|        120| 54013023|       1|       KR>12|             1|
|8205775c5387f9|        120| 44196592|       1|       IN>16|             2|
|9cb0ccd8458371|        120| 65817371|       1|   US>CA>807|             2|
+--------------+-----------+---------+--------+------------+--------------+
only showing top 5 rows
df_page_views.describe().show()
+-------+--------------+------------------+-------------------+------------------+------------+------------------+
|summary|          uuid|       document_id|          timestamp|          platform|geo_location|    traffic_source|
+-------+--------------+------------------+-------------------+------------------+------------+------------------+
|  count|       9999999|           9999999|            9999999|           9999999|     9999999|           9999999|
|   mean|      Infinity|1336961.4931401494|4.915974918146362E7|1.6514509651450966|        null| 1.499490649949065|
| stddev|           NaN| 639103.5676637741|2.215445190218439E7|0.6408070416101002|        null|0.7633959864429678|
|    min|100000e3a78374|                17|                 12|                 1|          --|                 1|
|    max|ffffffdee25725|           1893691|           86399982|                 3|       ZW>07|                 3|
+-------+--------------+------------------+-------------------+------------------+------------+------------------+
df_page_views.dtypes
[('uuid', 'string'),
 ('document_id', 'int'),
 ('timestamp', 'int'),
 ('platform', 'int'),
 ('geo_location', 'string'),
 ('traffic_source', 'int')]
df_page_views.select('timestamp').describe().show()
+-------+-------------------+
|summary|          timestamp|
+-------+-------------------+
|  count|            9999999|
|   mean|4.915974918146362E7|
| stddev|2.215445190218439E7|
|    min|                 12|
|    max|           86399982|
+-------+-------------------+
The sample has page view data from 6/14 only
# Page view sample data is from 6/14 only
max_timestamp = (86399982 + 1465876799998)/1000.0
min_timestamp = (12 ++ 1465876799998)/1000.0

print 'start time:', datetime.datetime.fromtimestamp(min_timestamp).strftime('%Y-%m-%d %H:%M:%S.%f')
print 'end time:', datetime.datetime.fromtimestamp(max_timestamp).strftime('%Y-%m-%d %H:%M:%S.%f')
start time: 2016-06-14 00:00:00.010000
end time: 2016-06-14 23:59:59.980000
Use Spark SQL
df_page_views.createOrReplaceTempView("temp_df_page_views")
# impressions by document_id
spark.sql('Create Table df_pv_by_doc AS (SELECT document_id, count(uuid) as impressions \
FROM temp_df_page_views Group by document_id Order by impressions DESC)').show(5)
spark.sql('Select * from df_pv_by_doc').show(5)
+-----------+-----------+
|document_id|impressions|
+-----------+-----------+
|    1811567|     429551|
|        234|     179692|
|      42744|     156231|
|    1858440|     112140|
|    1780813|     109624|
+-----------+-----------+
only showing top 5 rows
spark.sql('Select avg(impressions) FROM df_pv_by_doc').show()
+------------------+
|  avg(impressions)|
+------------------+
|167.08715266754666|
+------------------+
# impressions by user
spark.sql('Create Table df_pv_by_uuid AS (SELECT uuid, count(document_id) as impressions, \
    platform FROM temp_df_page_views Group by uuid, platform Order by impressions DESC)').show(5)
spark.sql('Select * from df_pv_by_uuid').show(5)
+--------------+-----------+--------+
|          uuid|impressions|platform|
+--------------+-----------+--------+
|eb084115822194|         14|       1|
|cd9cae9aba060c|         12|       1|
|72ca9f72e0c5e4|         12|       2|
|240485be779bc2|         11|       1|
|86402f4b23836b|         11|       1|
+--------------+-----------+--------+
only showing top 5 rows
spark.sql('Select avg(impressions), platform FROM df_pv_by_uuid group by platform').show()
+------------------+--------+
|  avg(impressions)|platform|
+------------------+--------+
|1.1181479760390243|       1|
|1.0792275836768672|       3|
|1.0600248127601748|       2|
+------------------+--------+
spark.sql('Select avg(impressions)FROM df_pv_by_uuid').show()
+------------------+
|  avg(impressions)|
+------------------+
|1.0866726969762894|
+------------------+
# Does an user view same document more than once within same day? - No
spark.sql('SELECT uuid, document_id, count(timestamp) FROM temp_df_page_views Group by uuid, document_id Order by count(timestamp) DESC').show(5)
+--------------+-----------+----------------+
|          uuid|document_id|count(timestamp)|
+--------------+-----------+----------------+
|5e77adbaadcc76|       2258|               1|
|98d5e2c4ae9848|       7012|               1|
|7d2ef9b2817da6|       7012|               1|
|1416bff7e93ceb|       7012|               1|
|301ab011f97440|       7012|               1|
+--------------+-----------+----------------+
only showing top 5 rows
df_page_views_pd = pd.read_csv("datasets/page_views_sample.csv")
# engagement level (pageviews per day by user)
page_views_per_user = df_page_views_pd.groupby(['uuid'])['document_id'].count()
# documents popularity (average daily impressions)
page_views_per_doc = df_page_views_pd.groupby(['document_id'])['uuid'].count()
Events
1. Load data
# read events in pyspark
df_events = spark.read.csv(
    path        =   "datasets/events.csv",
    header      =   True,
    mode        =   "DROPMALFORMED",   # Poorly formed rows in CSV are dropped rather than erroring entire operation
    inferSchema =   True               # Not always perfect but works well in most cases as of 2.1+
)
df_events.show(n=5)
+----------+--------------+-----------+---------+--------+------------+
|display_id|          uuid|document_id|timestamp|platform|geo_location|
+----------+--------------+-----------+---------+--------+------------+
|         1|cb8c55702adb93|     379743|       61|       3|   US>SC>519|
|         2|79a85fa78311b9|    1794259|       81|       2|   US>CA>807|
|         3|822932ce3d8757|    1179111|      182|       2|   US>MI>505|
|         4|85281d0a49f7ac|    1777797|      234|       2|   US>WV>564|
|         5|8d0daef4bf5b56|     252458|      338|       2|       SG>00|
+----------+--------------+-----------+---------+--------+------------+
only showing top 5 rows
df_events.select('timestamp').describe().show()
+-------+-------------------+
|summary|          timestamp|
+-------+-------------------+
|  count|           23120126|
|   mean|6.540050394022858E8|
| stddev|3.770035880180587E8|
|    min|                 61|
|    max|         1295999805|
+-------+-------------------+
df_events.dtypes
[('display_id', 'int'),
 ('uuid', 'string'),
 ('document_id', 'int'),
 ('timestamp', 'int'),
 ('platform', 'string'),
 ('geo_location', 'string')]
df_events_pd = pd.read_csv("datasets/events.csv")
2. Timestamp
# events data is from 6/14 - 6/28
max_timestamp = (1295999805 + 1465876799998)/1000.0
min_timestamp = (61 ++ 1465876799998)/1000.0

print 'start time:', datetime.datetime.fromtimestamp(min_timestamp).strftime('%Y-%m-%d %H:%M:%S.%f')
print 'end time:', datetime.datetime.fromtimestamp(max_timestamp).strftime('%Y-%m-%d %H:%M:%S.%f')
start time: 2016-06-14 00:00:00.059000
end time: 2016-06-28 23:59:59.803000
# What time do people view ads most (by hour)
df_events_pd['datetime'] = df_events_pd.timestamp.apply(lambda x: datetime.datetime.fromtimestamp((x+1465876799998)/1000.0).\
                             strftime('%Y-%m-%d %H:%M:%S.%f'))
df_events_pd['hour'] = df_events_pd['datetime'].apply(lambda x: x[11:13])
df_events_pd['day'] = df_events_pd['datetime'].apply(lambda x: x[:10])
hour_table = df_events_pd.groupby(['hour'])['display_id'].count()
day_table = df_events_pd.groupby(['day'])['display_id'].count()
objects = hour_table.index
y_pos = np.arange(len(objects))

fig, ax = plt.subplots(figsize=(16,7))
plt.bar(y_pos, hour_table, align='center', alpha=0.5)
plt.xticks(y_pos, objects)
plt.ylabel('Ads impressions')
plt.title('Number of ads viewed by hour', fontsize=14);
# What date do people viewed ads most (by day)
objects = day_table.index
y_pos = np.arange(len(objects))

fig, ax = plt.subplots(figsize=(16,7))
plt.bar(y_pos, day_table, align='center', alpha=0.5)
plt.xticks(y_pos, objects)
plt.ylabel('Ads impressions')
plt.title('Number of ads viewed by date', fontsize=14);
day_df_table = pd.DataFrame(day_table)
day_df_table.index = pd.DatetimeIndex(day_df_table.index)
day_df_table['dayofweek']=day_df_table.index.dayofweek
dayofweek_df_table = day_df_table.groupby(['dayofweek']).mean()
# What day of week do people viewed ads most (by day)
objects = ['Mon','Tue','Wed','Thu','Fri','Sat','Sun']
y_pos = np.arange(len(objects))

fig, ax = plt.subplots(figsize=(12,7))
plt.bar(y_pos, dayofweek_df_table['display_id'], align='center', alpha=0.5)
plt.xticks(y_pos, objects)
plt.ylabel('Ads impressions')
plt.title('Number of ads viewed by day', fontsize=14);
3. Impressions by document
df_events.createOrReplaceTempView("temp_df_events")
# number of display per document
spark.sql('Create table df_events_per_doc AS (SELECT document_id, count(display_id) as ad_impr \
        FROM temp_df_events Group by document_id Order by ad_impr DESC)').show(5)
spark.sql('Select * from df_events_per_doc').show(5)
+-----------+-------+
|document_id|ad_impr|
+-----------+-------+
|    1179111| 319203|
|     394689| 208574|
|    1827718| 195070|
|      38922|  86380|
|    1788295|  68509|
+-----------+-------+
only showing top 5 rows
spark.sql('Select avg(ad_impr) from df_events_per_doc').show(5)
+------------------+
|      avg(ad_impr)|
+------------------+
|25.859702928215107|
+------------------+
# % of documents viewed
df_events_pd_document_table = df_events_pd.groupby(['document_id']).count().groupby(['display_id']).count()
total_documents = df_events_pd_document_table.uuid.sum()
df_events_pd_document_table_percentage = df_events_pd_document_table.uuid.apply(lambda x: x/float(total_documents)*100)

print '-- {:.2f}% documents were viewed once with ads'.format(df_events_pd_document_table_percentage.iloc[0])
for i in [5, 10, 20, 100,1000,10000]:
    print '-- {:.2f}% documents were viewed more than {} times with ads'.format(df_events_pd_document_table_percentage.loc[i:].sum(),i)
-- 35.72% documents were viewed once with ads
-- 35.48% documents were viewed more than 5 times with ads
-- 22.19% documents were viewed more than 10 times with ads
-- 13.50% documents were viewed more than 20 times with ads
-- 3.56% documents were viewed more than 100 times with ads
-- 0.30% documents were viewed more than 1000 times with ads
-- 0.01% documents were viewed more than 10000 times with ads
4. Impressions by user
# number of display viewed per user (which platform)
spark.sql('Create table df_events_per_uuid AS (SELECT uuid, count(display_id) as ad_impr, \
platform FROM temp_df_events Group by uuid, platform Order by ad_impr DESC)').show(5)
spark.sql('Select * from df_events_per_uuid').show(5)
+--------------+-------+--------+
|          uuid|ad_impr|platform|
+--------------+-------+--------+
|b88553e3a2aa29|     49|       2|
|2759b057797f02|     46|       2|
|c0bd502c7a479f|     42|       2|
|45d23867dbe3b3|     38|       2|
|ef7761dd22277c|     38|       2|
+--------------+-------+--------+
only showing top 5 rows
spark.sql('Select avg(ad_impr) from df_events_per_uuid').show(5)
+------------------+
|      avg(ad_impr)|
+------------------+
|1.1679054462437826|
+------------------+
spark.sql('Select avg(ad_impr),platform from df_events_per_uuid group by platform').show(5)
+------------------+--------+
|      avg(ad_impr)|platform|
+------------------+--------+
| 1.173646996266563|       3|
|               1.0|    null|
|1.1860993337570247|       1|
|1.1517754111621799|       2|
+------------------+--------+
# % of users who viewed ads more than once
df_events_pd_user_table = df_events_pd.groupby(['uuid']).count().groupby(['display_id']).count()
total_users = df_events_pd_user_table.document_id.sum()
df_events_pd_user_table_percentage = df_events_pd_user_table.document_id.apply(lambda x: x/float(total_users)*100)

print '-- {:.2f}% users viewed ads only once'.format(df_events_pd_user_table_percentage.iloc[0])
print '-- {:.2f}% users viewed ads twice'.format(df_events_pd_user_table_percentage.iloc[1])
print '-- {:.2f}% users viewed ads three times'.format(df_events_pd_user_table_percentage.iloc[2])
print '-- {:.2f}% users viewed ads four times'.format(df_events_pd_user_table_percentage.iloc[3])
print '-- {:.2f}% users viewed ads more than five times'.format(df_events_pd_user_table_percentage.iloc[4:].sum())
-- 88.42% users viewed ads only once
-- 8.60% users viewed ads twice
-- 1.90% users viewed ads three times
-- 0.60% users viewed ads four times
-- 0.49% users viewed ads more than five times
5. User device
df_events_pd.platform.unique()
array(['3', '2', '1', '\\N'], dtype=object)
df_events_pd.platform = df_events_pd.platform.astype(str)
# plot user by platform
df_events_platform_table = df_events_pd.pivot_table(index='platform',values='uuid', aggfunc=[len])
# 1 = desktop, 2 = mobile, 3 = tablet
objects = ('desktop', 'mobile', 'tablet', 'NA')
y_pos = np.arange(len(objects))

fig, ax = plt.subplots(figsize=(12,7))
plt.bar(y_pos, df_events_platform_table.len, align='center', alpha=0.5)
plt.xticks(y_pos, objects)
plt.ylabel('Number of users')
plt.title('Number of users by platform', fontsize=14)

rects = ax.patches
values = df_events_platform_table.len.tolist()

for rect, value in zip(rects, values):
    height = rect.get_height()
    ax.text(rect.get_x() + rect.get_width()/2, height+5, value, ha='center', va='bottom')

platform_list =['desktop','mobile','tablet']
for i in range(3):
    platform = df_events_platform_table.len[i] / float(df_events_platform_table.len.sum()) * 100
    print '-- {:.2f}% users came from {}'.format(platform,platform_list[i])
-- 39.05% users came from desktop
-- 47.47% users came from mobile
-- 13.48% users came from tablet
# relationship between events and page_views on 6/14
# left join page_view sample and events on uuid, document, time

spark.sql('Create Table df_events_pv AS (SELECT e.display_id, pv.uuid, pv.document_id, \
    pv.timestamp, pv.platform, pv.geo_location, \
    pv.traffic_source FROM temp_df_page_views as pv left join temp_df_events as e \
    on pv.uuid = e.uuid and pv.document_id = e.document_id)').show(5)
# first 5 rows from the new joined table
spark.sql('select * from df_events_pv limit 5').show()
+----------+--------------+-----------+---------+--------+------------+--------------+
|display_id|          uuid|document_id|timestamp|platform|geo_location|traffic_source|
+----------+--------------+-----------+---------+--------+------------+--------------+
|      null|1000dc3f6a76c4|    1528733|  9451854|       2|       ZA>11|             1|
|      null|100212ee58431f|    1844981| 53400263|       1|   US>MI>563|             2|
|      null|10031b41dfb68f|    1815256| 32680250|       2|   US>IN>582|             1|
|      null|10045673acc2fb|    1786769|  4662714|       2|   US>OR>820|             3|
|      null|1005181847a1f9|    1758965|  8539642|       2|   US>CA>803|             1|
+----------+--------------+-----------+---------+--------+------------+--------------+
# display rate on 6/14 - 1.29% (number of display_id / number of uuid)
spark.sql('SELECT count(display_id) / count(uuid) from df_events_pv').show()
+-----------------------------------------------------------------+
|(CAST(count(display_id) AS DOUBLE) / CAST(count(uuid) AS DOUBLE))|
+-----------------------------------------------------------------+
|                                             0.012964149487121787|
+-----------------------------------------------------------------+
# display rate on 6/14 by platform - 3 (tablet) has the highest display rate, 1 (desktop) is
# the second, 2 (mobile) is the last one
spark.sql('SELECT count(display_id) / count(uuid), platform from df_events_pv \
        group by platform').show()
+-----------------------------------------------------------------+--------+
|(CAST(count(display_id) AS DOUBLE) / CAST(count(uuid) AS DOUBLE))|platform|
+-----------------------------------------------------------------+--------+
|                                              0.01396078659078594|       1|
|                                             0.017562003714453055|       3|
|                                             0.011122813337803399|       2|
+-----------------------------------------------------------------+--------+
6. Location
df_events_pd['country'] = df_events_pd.geo_location.astype('str').apply(lambda x: x[0:2])
def extract_state(x):
    if str(x)[0:2] == 'US':
        try:
            y = str(x)[3:5]
        except:
            y = np.nan
    else:
        y = 'Outside US'
    return y
df_events_pd['state'] = df_events_pd.geo_location.apply(lambda x: extract_state(x))
df_location_table = df_events_pd.groupby(['state'])['document_id'].count()
df_location_table =df_location_table.sort_values(ascending=False)
df_location_table = pd.DataFrame(df_location_table)
df_location_table
| document_id | |
|---|---|
| state | |
| Outside US | 4524674 |
| CA | 2395278 |
| TX | 1645323 |
| FL | 1128279 |
| NY | 1105926 |
| PA | 784612 |
| 758487 | |
| IL | 745661 |
| OH | 633699 |
| MI | 623564 |
| NC | 597003 |
| NJ | 537440 |
| GA | 528729 |
| VA | 520956 |
| WA | 432731 |
| MA | 423000 |
| AZ | 378966 |
| MD | 359724 |
| CO | 345236 |
| MN | 311927 |
| TN | 303689 |
| WI | 291747 |
| MO | 290877 |
| IN | 266973 |
| OR | 260209 |
| CT | 219261 |
| AL | 213932 |
| SC | 206991 |
| KY | 182070 |
| LA | 181903 |
| OK | 150365 |
| IA | 143605 |
| KS | 142806 |
| UT | 139593 |
| NV | 138275 |
| MS | 107735 |
| DC | 106562 |
| NE | 106380 |
| AR | 101745 |
| NM | 92545 |
| HI | 82223 |
| NH | 71553 |
| DE | 70580 |
| WV | 69734 |
| ID | 69638 |
| ME | 62438 |
| RI | 49204 |
| MT | 42716 |
| AK | 38516 |
| SD | 36643 |
| ND | 34799 |
| VT | 28466 |
| WY | 24841 |
| AE | 7092 |
| AP | 3141 |
| AA | 64 |
total_item = float(df_location_table.document_id.sum())
df_location_table['percentage'] = df_location_table.document_id.map(lambda x: x/total_item*100)
df_location_table.head()
| document_id | percentage | |
|---|---|---|
| state | ||
| Outside US | 4524674 | 19.570283 |
| CA | 2395278 | 10.360143 |
| TX | 1645323 | 7.116410 |
| FL | 1128279 | 4.880073 |
| NY | 1105926 | 4.783391 |
fig,ax = plt.subplots(figsize=(15, 7))
sns.barplot(df_location_table.index, df_location_table.values, order=df_location_table.index, alpha=1)
plt.ylabel('Total impressions')
plt.title('Ad Impression by location', fontsize=14);
Documents
# read categories in pyspark
df_categories = spark.read.csv(
    path        =   "datasets/documents_categories.csv",
    header      =   True,
    mode        =   "DROPMALFORMED",   # Poorly formed rows in CSV are dropped rather than erroring entire operation
    inferSchema =   True               # Not always perfect but works well in most cases as of 2.1+
)
# read entities in pyspark
df_entities = spark.read.csv(
    path        =   "datasets/documents_entities.csv",
    header      =   True,
    mode        =   "DROPMALFORMED",   # Poorly formed rows in CSV are dropped rather than erroring entire operation
    inferSchema =   True               # Not always perfect but works well in most cases as of 2.1+
)
# read meta in pyspark
df_meta = spark.read.csv(
    path        =   "datasets/documents_meta.csv",
    header      =   True,
    mode        =   "DROPMALFORMED",   # Poorly formed rows in CSV are dropped rather than erroring entire operation
    inferSchema =   True               # Not always perfect but works well in most cases as of 2.1+
)
# read topics in pyspark
df_topics = spark.read.csv(
    path        =   "datasets/documents_topics.csv",
    header      =   True,
    mode        =   "DROPMALFORMED",   # Poorly formed rows in CSV are dropped rather than erroring entire operation
    inferSchema =   True               # Not always perfect but works well in most cases as of 2.1+
)
df_categories_pd = pd.read_csv("datasets/documents_categories.csv")
df_entities_pd = pd.read_csv("datasets/documents_entities.csv")
df_meta_pd = pd.read_csv("datasets/documents_meta.csv")
df_topics_pd = pd.read_csv("datasets/documents_topics.csv")
1. Categories
df_categories_pd.head()
| document_id | category_id | confidence_level | |
|---|---|---|---|
| 0 | 1595802 | 1611 | 0.92 |
| 1 | 1595802 | 1610 | 0.07 |
| 2 | 1524246 | 1807 | 0.92 |
| 3 | 1524246 | 1608 | 0.07 |
| 4 | 1617787 | 1807 | 0.92 |
len(df_categories_pd.category_id.unique())
97
categories_table = df_categories_pd.groupby(['category_id'])['document_id'].count()
categories_table = categories_table.sort_values()
categories_table[categories_table>1000].sum()
5480969
fig,ax = plt.subplots(figsize=(12, 7))
sns.barplot(categories_table.index, categories_table.values, order=categories_table.index, alpha=1)
plt.ylabel('Total occurences')
plt.title('Category occurences', fontsize=14);

total_num = float(len(df_categories_pd.category_id.unique()))
for i in [10, 1000, 10000, 50000, 100000,500000]:
    print '-- {:.3f}% of categories appeared in more than {} documents'.format(categories_table[categories_table>i].count() / total_num *100,i)
-- 91.753% of categories appeared in more than 10 documents
-- 90.722% of categories appeared in more than 1000 documents
-- 67.010% of categories appeared in more than 10000 documents
-- 36.082% of categories appeared in more than 50000 documents
-- 15.464% of categories appeared in more than 100000 documents
-- 1.031% of categories appeared in more than 500000 documents
2. Topics
df_topics_pd.head()
| document_id | topic_id | confidence_level | |
|---|---|---|---|
| 0 | 1595802 | 140 | 0.073113 |
| 1 | 1595802 | 16 | 0.059416 |
| 2 | 1595802 | 143 | 0.045421 |
| 3 | 1595802 | 170 | 0.038867 |
| 4 | 1524246 | 113 | 0.196450 |
len(df_topics_pd.topic_id.unique())
300
topics_table = df_topics_pd.groupby(['topic_id'])['document_id'].count()
topics_table = topics_table.sort_values()
topics_table
topic_id
293      1717
122      1839
123      1866
288      1883
251      1929
34       2008
40       2094
88       2450
99       2477
245      2492
195      2574
14       2584
218      2638
171      2694
273      2799
169      2817
236      2866
59       2959
31       3017
76       3091
28       3107
50       3238
158      3281
212      3304
188      3307
114      3328
7        3378
253      3498
278      3636
272      3704
        ...
260     91576
26      91760
294     92037
74      92482
252     95091
254     95615
97      98549
92      98563
265    101952
249    102675
25     105219
24     106559
43     111586
258    120182
153    121627
160    121968
231    122104
216    123496
136    124320
173    135951
8      139734
49     154783
235    156856
107    157643
181    177946
143    181260
140    195645
20     226877
184    256028
16     268216
Name: document_id, dtype: int64
total_num_2 = float(300)
for i in [5000, 10000, 50000,100000,200000]:
    print '-- {:.3f}% of topics appeared in more than {} documents'.format(topics_table[topics_table>i].count() / total_num_2 *100,i)


fig,ax = plt.subplots(figsize=(12, 7))
sns.barplot(topics_table.index, topics_table.values, order=topics_table.index, alpha=1)
plt.ylabel('Total occurences')
plt.title('Topic occurences', fontsize=14);
-- 84.333% of topics appeared in more than 5000 documents
-- 67.000% of topics appeared in more than 10000 documents
-- 28.667% of topics appeared in more than 50000 documents
-- 7.333% of topics appeared in more than 100000 documents
-- 1.000% of topics appeared in more than 200000 documents
3. Bucket confidence level
bin = np.arange(0,1.1,0.1)
group_name = np.arange(1,11)
df_categories_pd['c_level'] = pd.cut(df_categories_pd.confidence_level,bin,labels=group_name)
df_topics_pd['c_level'] = pd.cut(df_topics_pd.confidence_level,bin,labels=group_name)
Train and Test data
# read content in pyspark
df_content = spark.read.csv(
    path        =   "datasets/promoted_content.csv",
    header      =   True,
    mode        =   "DROPMALFORMED",   # Poorly formed rows in CSV are dropped rather than erroring entire operation
    inferSchema =   True               # Not always perfect but works well in most cases as of 2.1+
)
# read content in pyspark
df_train = spark.read.csv(
    path        =   "datasets/clicks_train.csv",
    header      =   True,
    mode        =   "DROPMALFORMED",   # Poorly formed rows in CSV are dropped rather than erroring entire operation
    inferSchema =   True               # Not always perfect but works well in most cases as of 2.1+
)
# read content in pyspark
df_test = spark.read.csv(
    path        =   "datasets/clicks_test.csv",
    header      =   True,
    mode        =   "DROPMALFORMED",   # Poorly formed rows in CSV are dropped rather than erroring entire operation
    inferSchema =   True               # Not always perfect but works well in most cases as of 2.1+
)
df_train_pd = pd.read_csv("datasets/clicks_train.csv")
df_test_pd = pd.read_csv("datasets/clicks_test.csv")
df_test_pd.head()
| display_id | ad_id | |
|---|---|---|
| 0 | 16874594 | 66758 |
| 1 | 16874594 | 150083 |
| 2 | 16874594 | 162754 |
| 3 | 16874594 | 170392 |
| 4 | 16874594 | 172888 |
# Ads occurences
df_train_table = df_train_pd.groupby(['ad_id'])['display_id'].count()
df_train_table.sort_values()
ad_id
268955         1
230025         1
230029         1
230031         1
230032         1
230038         1
230039         1
230041         1
230045         1
230023         1
230046         1
230052         1
230057         1
230059         1
230061         1
230063         1
230065         1
230067         1
230068         1
230051         1
230014         1
230010         1
230009         1
229953         1
229954         1
229955         1
229960         1
229961         1
229962         1
229969         1
           ...
270253     91158
55518      93412
141024     94865
116261     96419
25876     101897
26711     104259
187797    108989
57071     109595
269777    110620
95103     111281
61159     111718
190062    111894
173130    111937
190216    113798
92759     115654
202812    115819
228959    116295
288385    117057
174547    123899
225438    124462
173403    128030
288396    128607
130952    135789
138353    144467
347688    147877
173006    168139
151028    181319
123742    202099
180923    203159
173005    211824
Name: display_id, dtype: int64
total_ads = float(len(df_train_table))
print '-- {:.2f}% ads appeared once'.format(len(df_train_table[df_train_table==1])/total_ads*100)
for i in [5,10, 100, 1000, 10000, 100000]:
    print '-- {:.2f}% ads appeared more than {} times'.format(len(df_train_table[df_train_table>i])/total_ads*100, i)
-- 22.69% ads appeared once
-- 49.32% ads appeared more than 5 times
-- 36.24% ads appeared more than 10 times
-- 8.91% ads appeared more than 100 times
-- 2.55% ads appeared more than 1000 times
-- 0.36% ads appeared more than 10000 times
-- 0.01% ads appeared more than 100000 times
# % of test ads in train data
df_test_table = df_test_pd.groupby(['ad_id'])['display_id'].count()
result = (len(df_test_table.index[df_test_table.index.isin(df_train_table.index)])/float(len(df_test_table.index)))
print '{:.2f}% ads in test dataset appeared in training dataset'.format(result*100)
82.87% ads in test dataset appeared in training dataset